Recently I was invited to a Data and Activism retreat at Lancaster University, and asked to give a brief primer on data for the non-techies at the start of the two days. These are my slides and notes for the talk; and I’ve also written up my thoughts on the event itself, along with some further links to explore
Hello! I’m looking forward to this retreat. I’m Adrian McEwen, I connect strange things to the Internet for a living and so I’m completely at home with the “data” side of things. I’m very much a beginner on the “activism” side though, so looking forward to learning lots over the next two days.

There’s a common perception that data presents this perfect, unassailable truth. These are the FACTS, so you can’t challenge them.
I don’t think that’s really true.
Once you start collecting, and working with data yourself, you discover that you often need to process and clean the raw data before it’s any use; you realise some of the assumptions being made in the way that you’re collecting it; or that the data you decide to gather depends on the questions you want to ask.
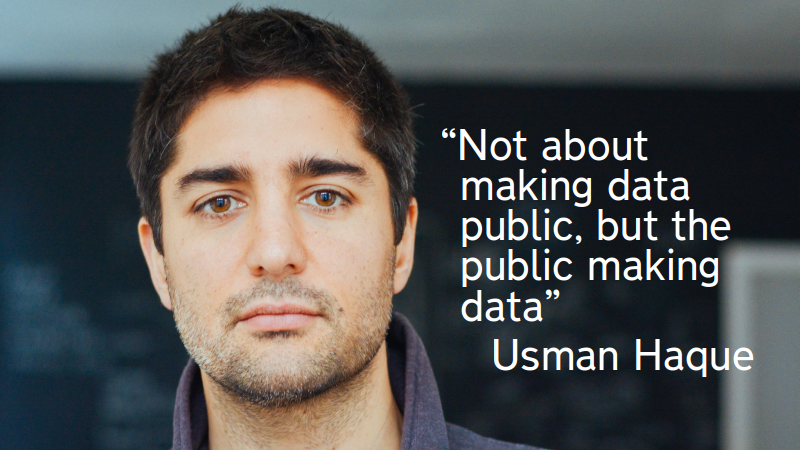
That’s why I love this quote from Usman Haque. The more that people engage in making data, the better they will be at critically assessing data gathered by others.
At the risk of upsetting all the data scientists here, there’s a lot of data analysis that you can do without a degree in Computer Science.
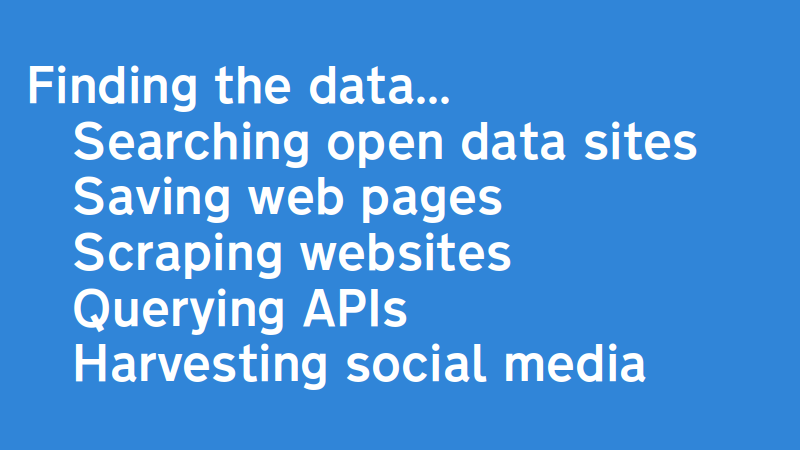
First off you need to find, or get the data.
Maybe that’s by downloading some packaged data from an open data website; or it could be as simple as saving some web pages with the information on that you want; going one step further you’d need to write a bit of code, but there are lots of examples, to “scrape” the webpages—basically automating the saving web pages step; then there’s writing code to talk to a purpose-built interface for that, called an API; and obviously all our social media obsessions provide lots of data too.
Those are listed roughly in order of complexity, from “no coding required” through to “might need to find a friendly geek”.
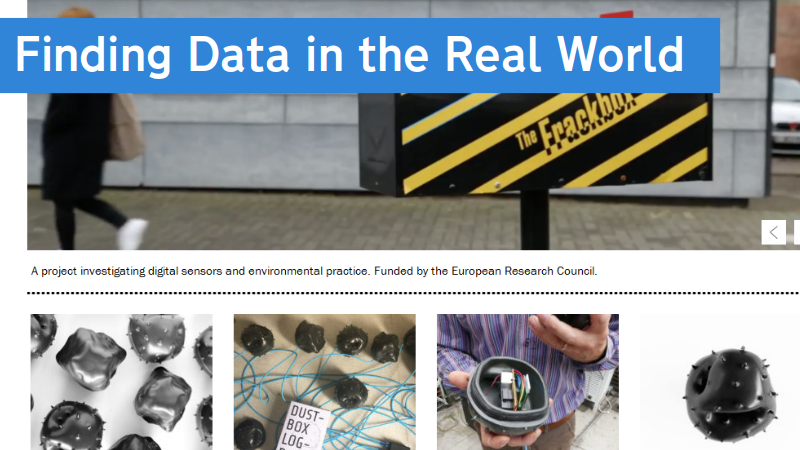
And given what I do for a living, it would be remiss of me not to mention the wealth of cheap sensors available now to let us gather information from the real world directly.
With hardware devices like the Arduino and Raspberry Pi and the wealth of code and how-to guides being shared by the Open Source and Maker communities, it’s possible for ordinary people to build and deploy their own sensor collections.
The photo is of a project called Citizen Sense. I did some circuit design for them on the air quality sensors you can see at the bottom; and their Frackbox fracking sensors helped some communities in the US in their fight against the companies fracking in their area.
Once you’ve got some data, you’ll need to do something with it. The first step in that is understanding what you’ve got.
There are a raft of different formats that data comes in, but these are some of the more common. You don’t need to be able to completely understand them, but it’s useful to be able to eyeball them and get a feel for the information they contain.
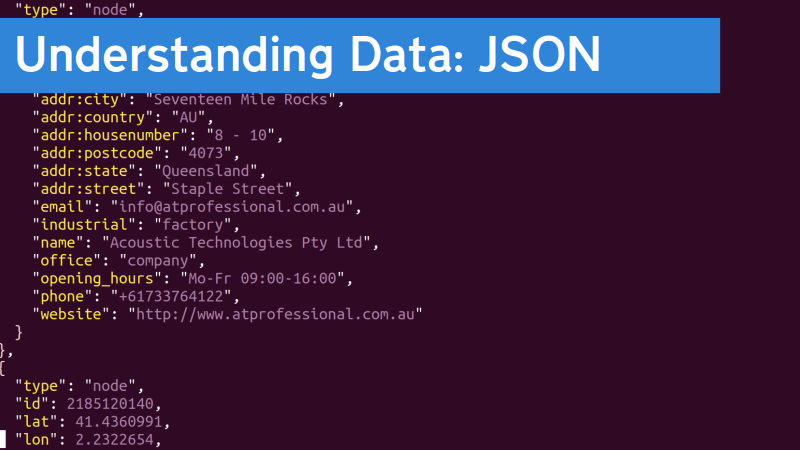
This is JSON, and you can see that it’s mostly a set of fields and values. The fields are the bits shown here in yellow, and their respective values in purple.
I got this from a dataset of factories that I’ve made, and you can see it has things like the name and the website of each factory, and also details like “lat” and “lon” which are the latitude and longitude coordinates for that site.
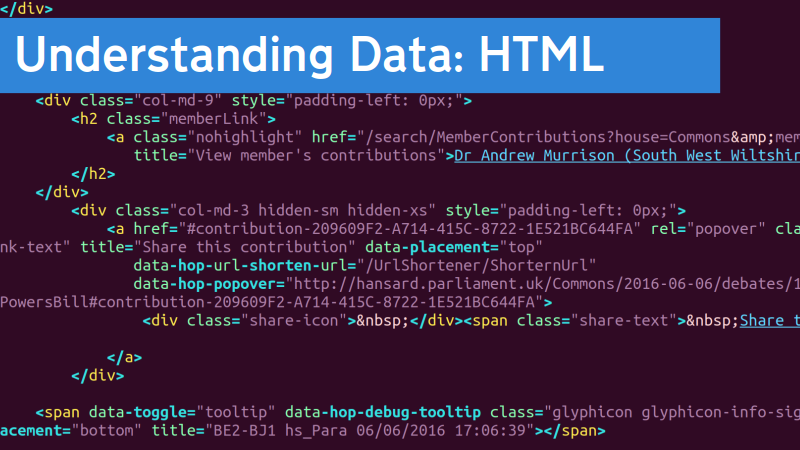
Then we’ve got HTML, which is what’s behind any web page. If you “view source” in your browser, you’ll see something like this.
This particular page is from the Hansard website, showing the speeches by MPs during the reading of the Investigatory Powers Bill. There are lots of < and > tags that mark this out as HTML, but you can also pick out things like the names of the MP—Dr Andrew Murrison in this case.
The MP’s name is contained in a <h2 class="memberLink"> element, so I could use that to filter out all the names of the MPs who spoke in the debate.
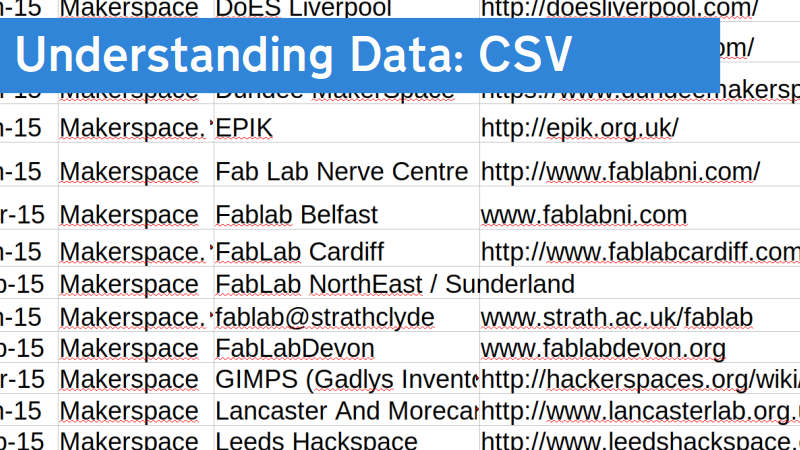
And this is a particular form of saving spreadsheets, into a list of Comma Separated Values, hence the name. It’s a more universal format than Excel spreadsheets and is common from open data sets.
You can open it in Excel or similar and save as that format from there too, which lets you combine the power of Excel with some text processing or coding: save your spreadsheet as a CSV; run it through some code to process it and generate a new CSV; load that new one back into Excel to work on it some more…
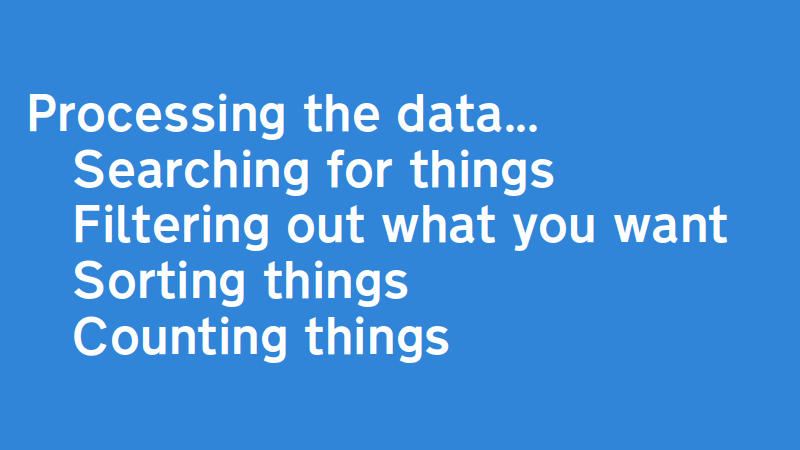
There are lots more advanced things you can do when processing the data you’ve gathered, but you can get a long way with combinations of these four.
And you can do lots of these with minimal, or even no, coding.
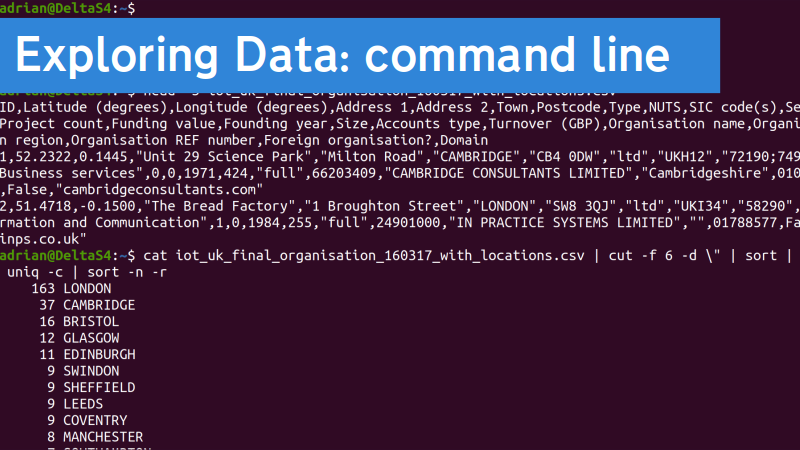
Lots of the time you can semi-ignore the format of the data you’ve got, and just treat it as messy text. Then there’s a bunch of tools you can use to do some processing of it.
I ran a workshop on using the command line to process text data a while back as part of a course on data for artists that Ross Dalziel organised, if you want to dig into it further.
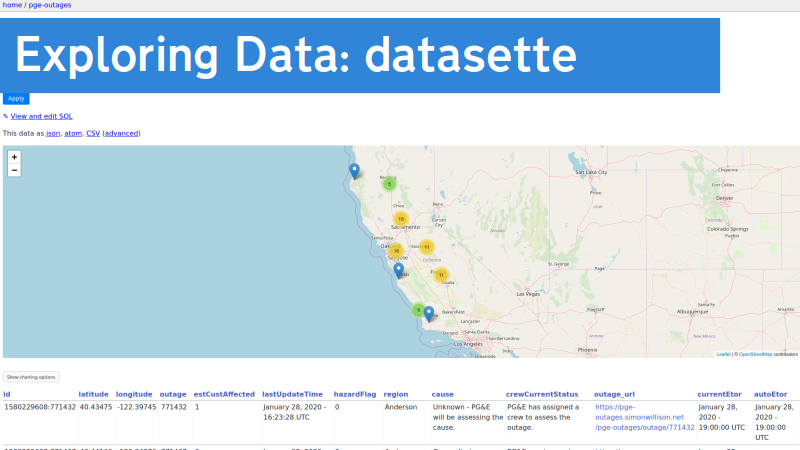
Another great tool for exploring data is Simon Willison’s datasette.
It takes a database file (and he, and others, are building tools to turn a CSV, or your tweets, or health data, into a database) and makes it easy to build (and publish for others to use!) a web interface to look at the data.
There’s more info on the project and pointers to a bunch of examples on Simon’s blog.
Once you’ve processed your data, you might want to repeat the process regularly to see how things change.
Computers are good at repeating pre-defined processes, and there are services like Morph.io which provide services to help with that, often with free tiers if your usage isn’t too heavy.
And you might want to publish the results online to get word out. Again, services such as Heroku will let you do that, with free options for lower usage.
If you’ve worked out that there is some heavier-lifting to be done with the technical side of things then you might need to find some help.
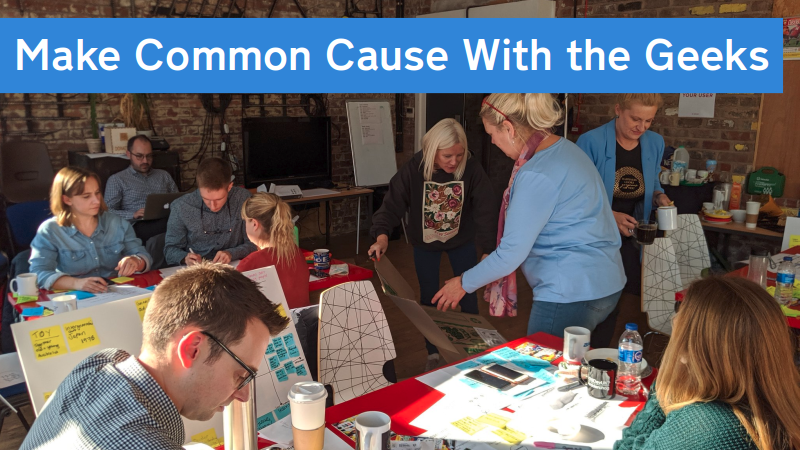
One way to do that is to find your local makerspace or hack(er)space. Most cities have one (or more) these days, as do an increasing number of towns. They’ll often have an open evening which is free for anyone to attend, and that’s usually a more social occasion with more of the members there.
This photo is from a recent GovJam service design jam in Liverpool, held in DoES Liverpool—the makerspace I hang out in (and work from, and co-founded).
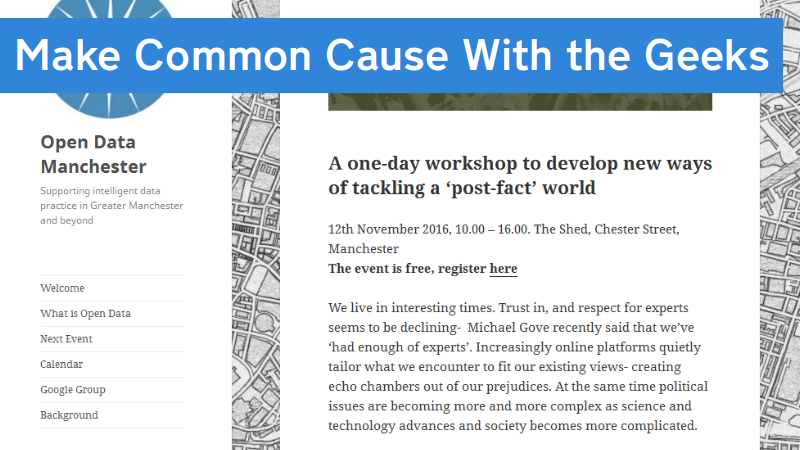
Meetups are the other way that the geeks will gather, generally based around learning more about a particular technology or area-of-interest.
If you strike lucky you’ll find something like Open Data Manchester but Meetup.com is a good place to go hunting.

“Civic tech” is another useful name for this sort of thing. In Liverpool some of the activity around that has been under the #CodeForLiverpool banner, and I’ve been picking at this some more of late
And if you can’t find anything appropriate, start your own! The are many geeks who want to make the world better and more and more are realising that newer! shinier! tech! doesn’t automatically make that so. Especially given the current political turmoil.
Just as the activists can learn from the geeks, so too can the geeks learn from the activists.
